
Campaigns and Creatives reports
The Campaigns and Creatives reports show how each LinkedIn campaign and each ad performs over time. Select rows in the table to compare them on one chart.
Campaigns report
Go to Ad Analytics → Campaigns.
Set the date range at the top.
In Campaign performance, choose Impressions, Clicks or Engagements.
Tick the campaigns you want to compare in the table. Each selected campaign gets its own line on the chart.
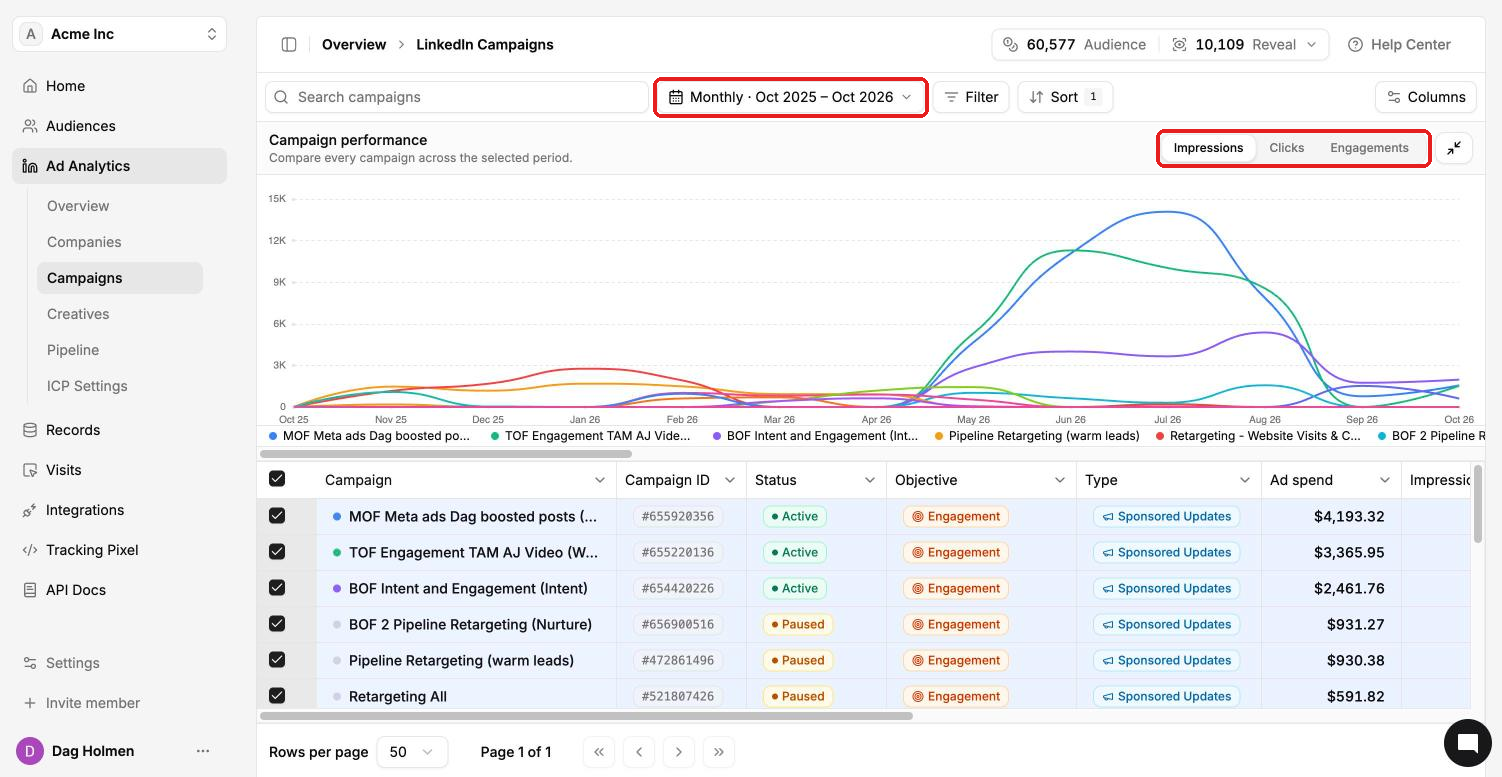
The table includes Campaign, Campaign ID, Status (Active or Paused), Objective, Type, Ad spend, Impressions and more. Use Filter, Sort and Columns to adjust it, and the search box to find a campaign by name.
Creatives report
Go to Ad Analytics → Creatives. It works the same way, but for individual ads.
Set the date range and, if you like, pick one campaign from All campaigns.
In Creative performance, choose Impressions, Clicks or Engagements.
Select creatives in the table to compare them on the chart.
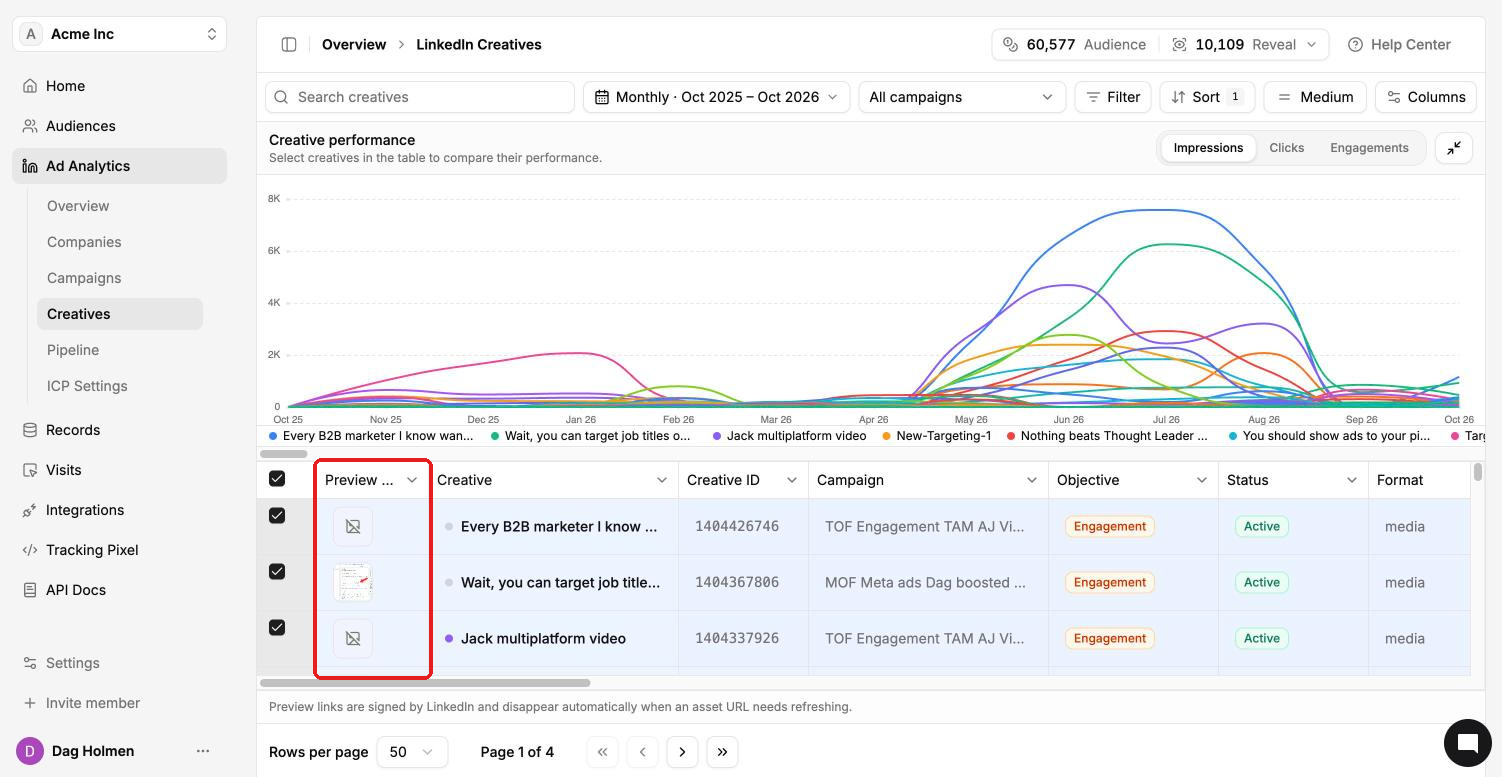
Columns include Preview, Creative, Creative ID, Campaign, Objective, Status and Format.
Preview links are signed by LinkedIn. They disappear when an asset URL needs refreshing, so some rows may show an empty preview.