
The LinkedIn Companies report
The Companies report lists every company LinkedIn reports for your ads, with impressions, clicks and engagement for each. Use it to find the accounts that pay attention to your ads.
Open the report
Go to Ad Analytics → Companies, or click See all in the Companies section of the Overview page.
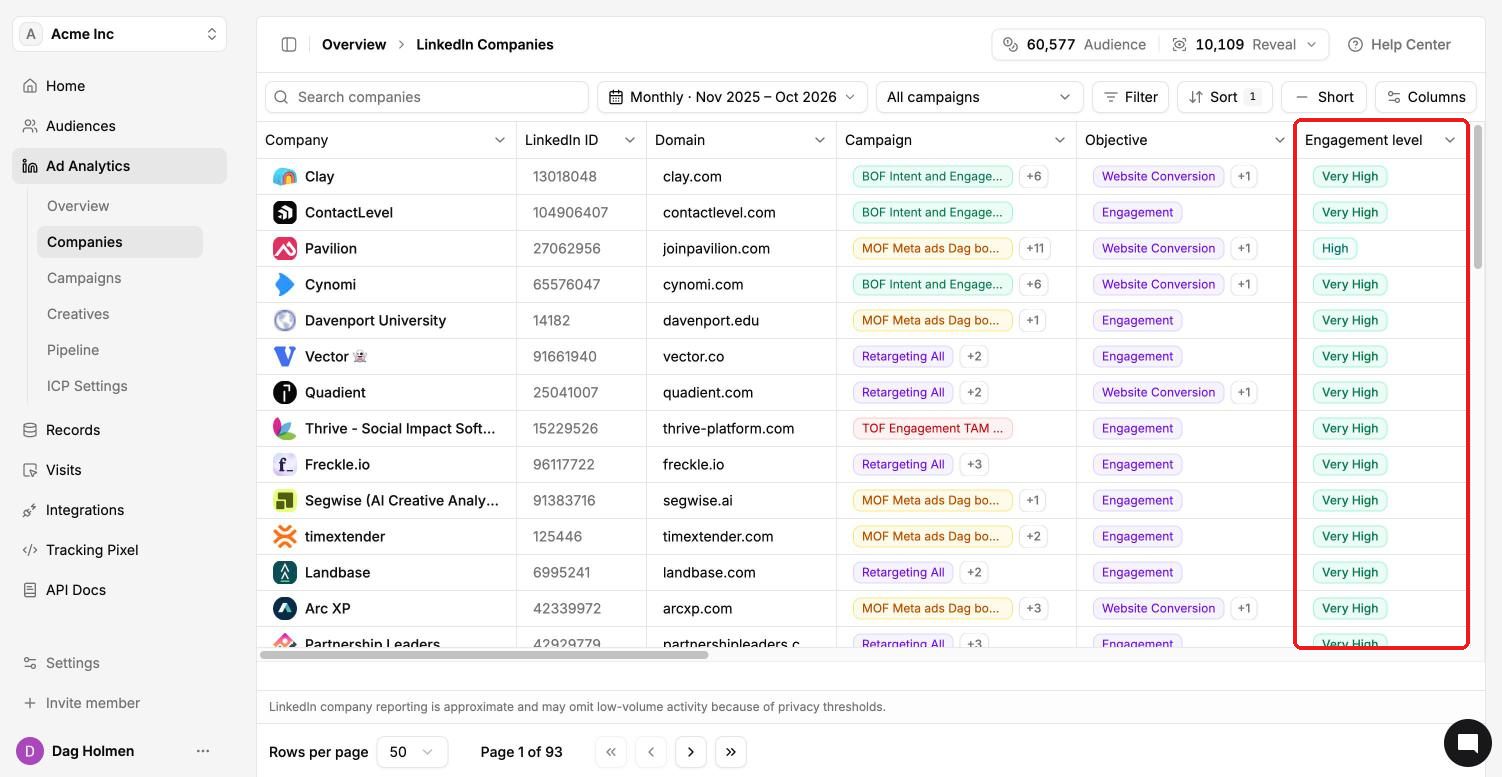
Columns
Use Columns to choose what you see. Available columns include:
Company, LinkedIn ID, Domain, Campaign and Objective.
Engagement level: Very High, High and lower levels, based on a scoring of the company's engagement with your ads.
Impressions, Engagements, Clicks, Landing page clicks, Reactions, Comments, Shares, Follows and Video views.
Campaigns reached, Campaigns engaged and Engagement rate.
First seen and Last seen.
Search, filter and sort
Search by company name.
Change the date range or pick a campaign from All campaigns.
Use Filter and Sort to narrow the list. The density toggle switches between compact and roomier rows.
Click any company to open its company record, with firmographics, visits and its LinkedIn and CRM journey.
LinkedIn company reporting is approximate. It may leave out low-volume activity because of LinkedIn's privacy thresholds.
Warm companies without a deal
On Ad Analytics → Overview, the Warm companies without a deal table lists companies engaging with your ads that aren't connected to an existing CRM deal. These are good accounts to hand to sales.
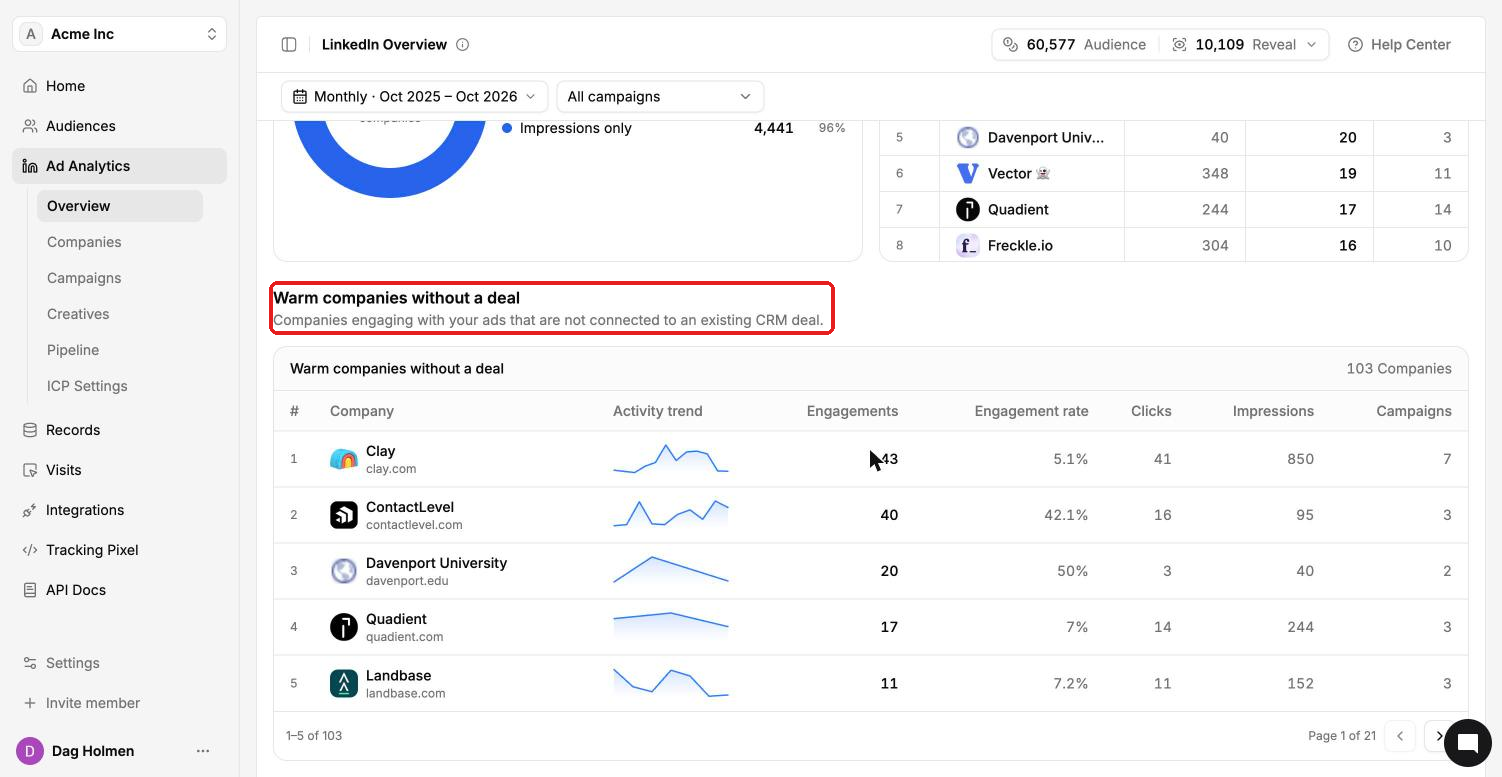
For each company you see the activity trend, engagements, engagement rate, clicks, impressions and number of campaigns. This table needs HubSpot or Salesforce connected under Integrations → Connections.