Pipeline analysis: LinkedIn's influence on your deals
Pipeline analysis connects your LinkedIn ad activity to the deals in your CRM. You see how many deals LinkedIn influenced, how much open pipeline and won revenue they represent, and at which stages.
Before you start
Connect LinkedIn Analytics under Integrations → Connections.
Connect HubSpot CRM or Salesforce CRM on the same page.
Set up the view
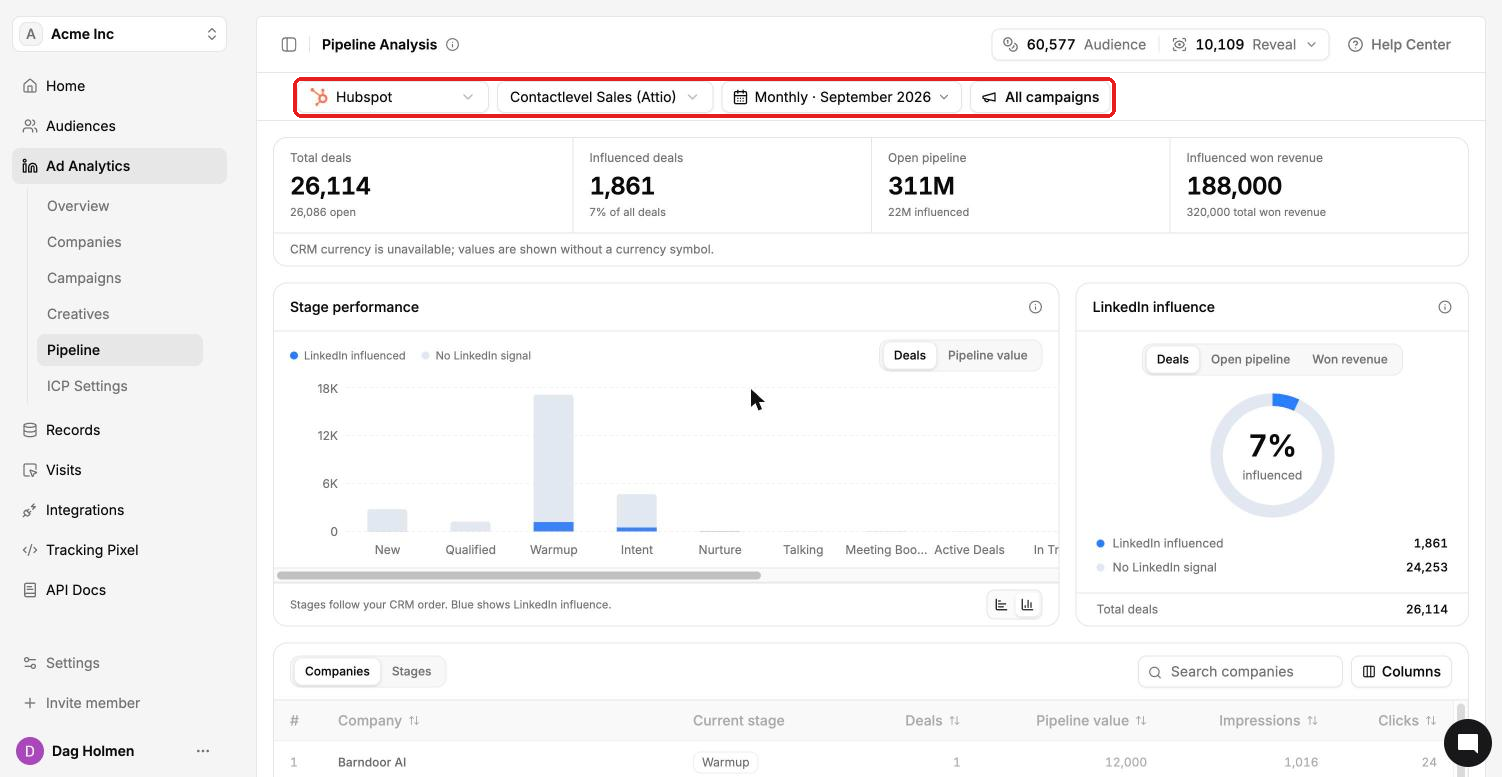
Go to Ad Analytics → Pipeline.
Pick your CRM (HubSpot or Salesforce) in the first dropdown.
Pick the pipeline you want to analyse.
Set the date range and choose campaigns (All campaigns by default).
What the page shows
Total deals, Influenced deals (with the share of all deals), Open pipeline (influenced) and Influenced won revenue.
Stage performance: a chart per pipeline stage, split into LinkedIn influenced and No LinkedIn signal. Switch between Deals and Pipeline value. Stages follow your CRM order.
LinkedIn influence: a donut chart for Deals, Open pipeline or Won revenue.
A table by Companies or Stages, with company, current stage, deals, pipeline value, impressions and clicks.
What counts as LinkedIn-influenced
A deal counts as LinkedIn-influenced when the company reached both an impression threshold and an engagement threshold from your ads. You can set these thresholds yourself.
Look at one company's journey
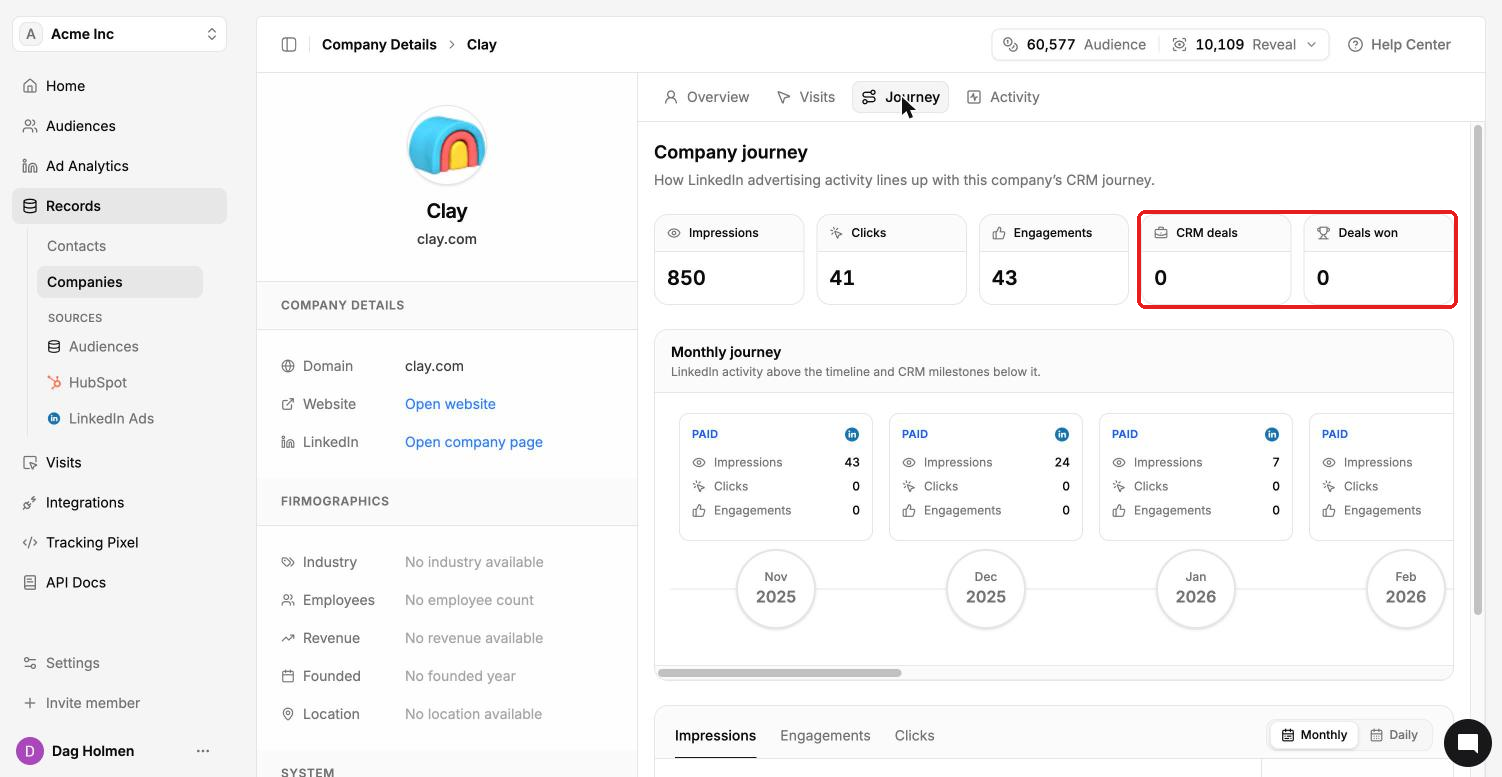
Click a company to open its record, then the Journey tab. It shows how LinkedIn advertising activity lines up with that company's CRM journey: impressions, clicks, engagements, CRM deals and deals won. A monthly timeline puts LinkedIn activity above and CRM milestones below.