
Getting started with LinkedIn Ad Analytics
Ad Analytics shows who your LinkedIn ad spend actually reaches, at company level. You see which companies saw and engaged with your ads, how closely that audience matches your ideal customer profile, and how much spend lands outside it. It's part of the free Analytics plan.
Ad Analytics covers LinkedIn only for now.
Connect LinkedIn Analytics
Go to Integrations → Connections.
Open LinkedIn Analytics and click Connect LinkedIn Analytics.
Log in to LinkedIn and choose the ad account you want to report on.
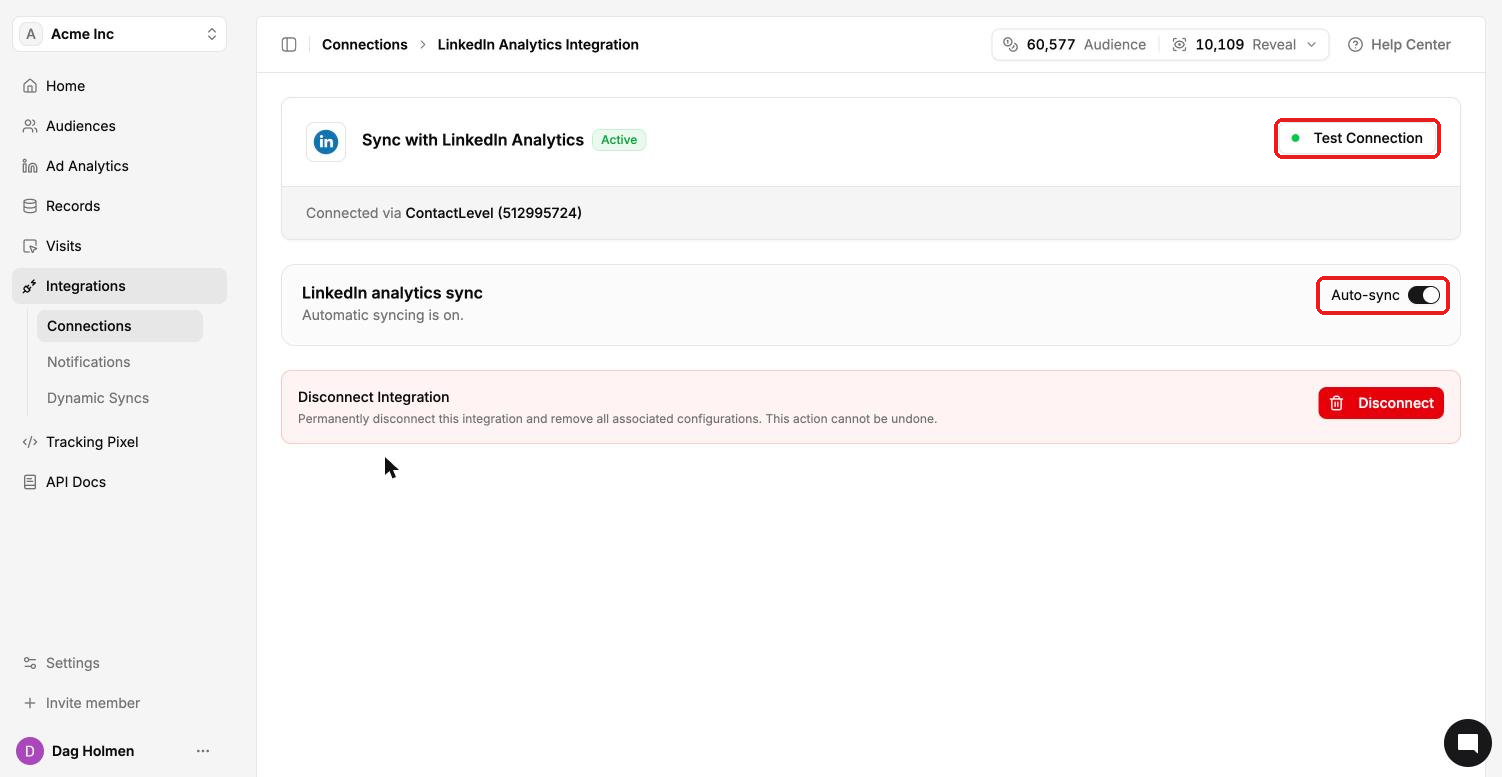
When the connection works, the page shows "Sync with LinkedIn Analytics" as Active and "Connected via" your ad account. The Auto-sync toggle keeps data updating on its own ("Automatic syncing is on"). Click Test Connection to check it at any time.
Set your ICP
Before you read the reports, fill in Ad Analytics → ICP Settings with the companies and personas you want to reach. ICP alignment and the targeting opportunity are measured against these settings.
The Overview page
Go to Ad Analytics → Overview. Use the date range picker (for example Monthly · Oct 2025 – Oct 2026) and the campaign filter (All campaigns) at the top. Every section on the page follows these filters.
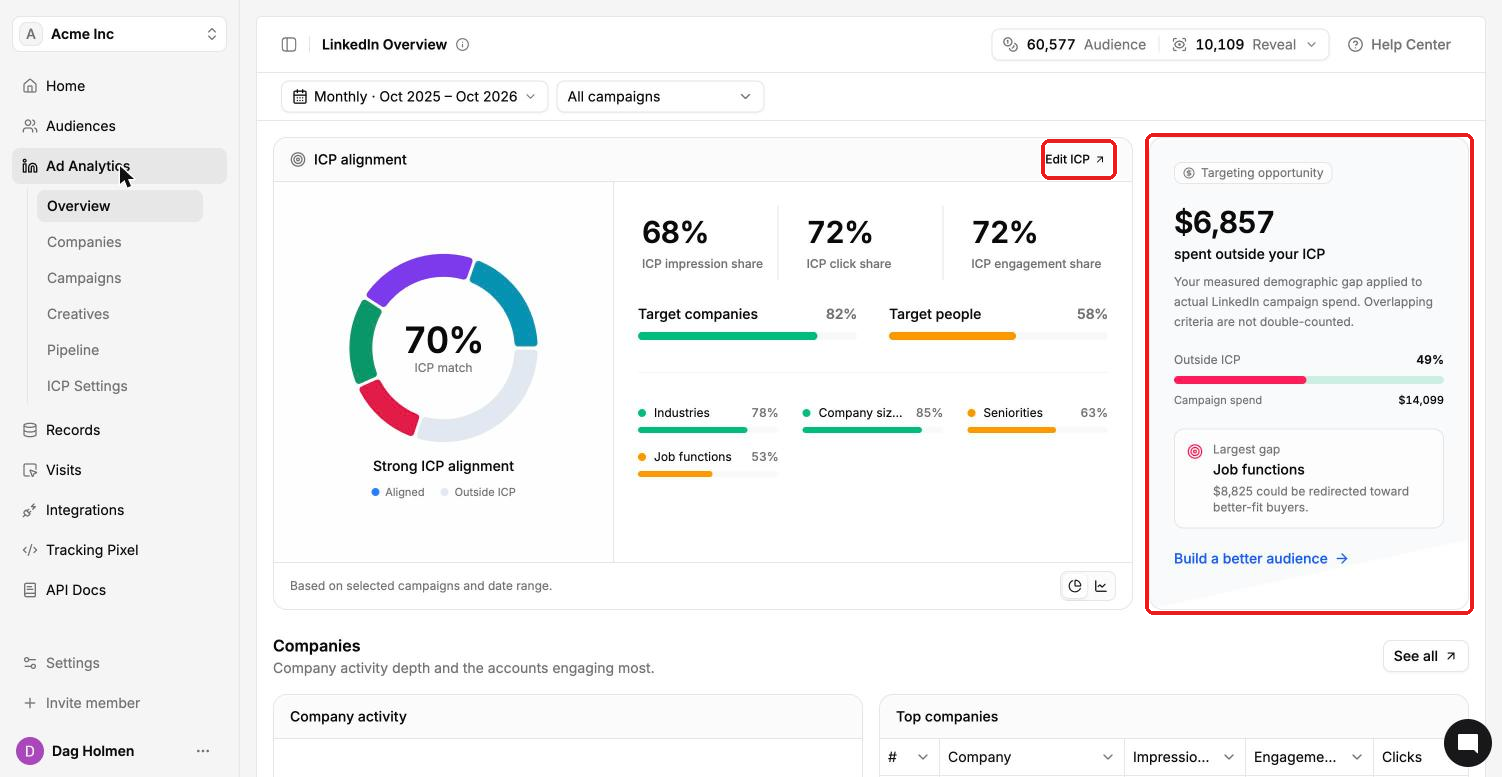
ICP alignment: your overall ICP match, ICP impression, click and engagement share, Target companies and Target people percentages, and a match score per criterion (Industries, Company sizes, Seniorities, Job functions). Edit ICP opens ICP Settings.
Targeting opportunity: how much of your LinkedIn spend went to people outside your ICP, and the largest gap.
Companies: company activity (Engaged, Clicked, Impressions only) and your top companies. See all opens the full Companies report.
Warm companies without a deal: companies engaging with your ads that aren't tied to a CRM deal. Needs HubSpot or Salesforce connected.
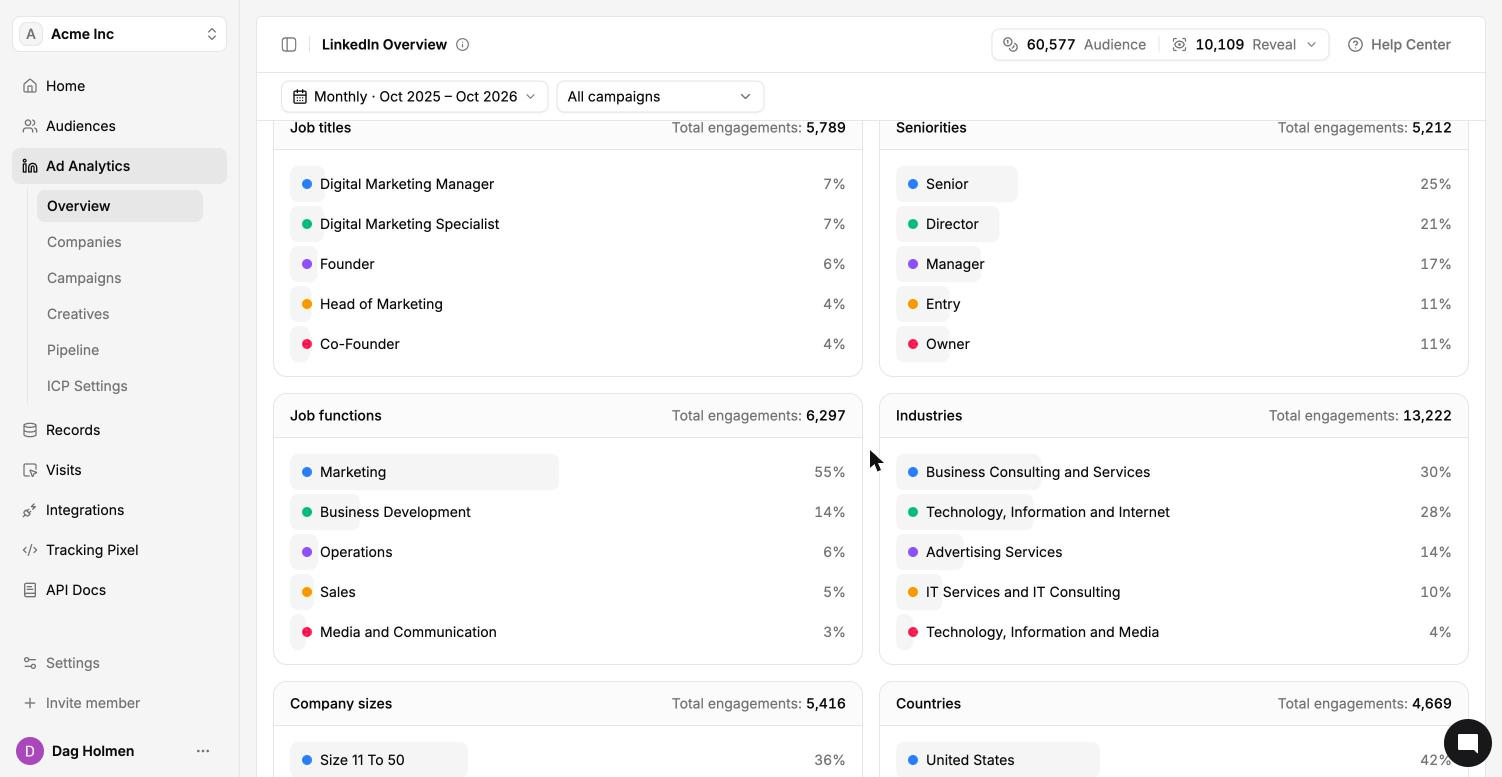
Demographics: job titles, seniorities, job functions, industries, company sizes and countries. Switch between Engagements, Impressions and Clicks.
The Home page shows a short version of these numbers on its LinkedIn analytics tab. Home uses its own default date range, so its numbers can differ from Overview.
The other reports
Companies: every company LinkedIn reports for your ads.
Campaigns and Creatives: performance by campaign and by ad.
Pipeline: how LinkedIn ads relate to deals in HubSpot or Salesforce.